How to get performance data from a First Generation VNXe (VNXe3100, VNXe 3150, or VNXe3300)
You will need the SPCollects from the VNXe (Instructions here). You can easily grab them from inside Unisphere.
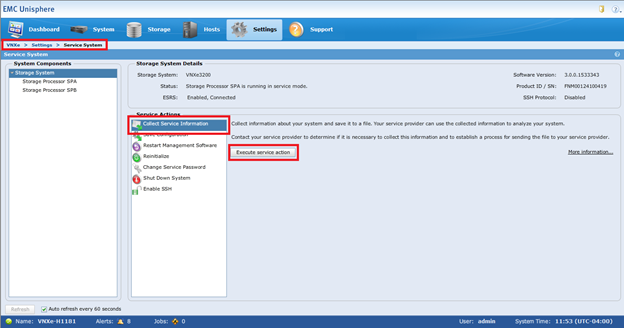
You will need to parse the SPCollects with the Triiage tool from EMC (note: you will need a support.emc.com account to get it). The tool was created as a pilot to automate the manual steps involved in triaging SPCollects and speed up analysis by providing engineers with pre-triaged SPCollects.
After you get the SPCollects you can place the single “.Tar” file in a folder all by itself.

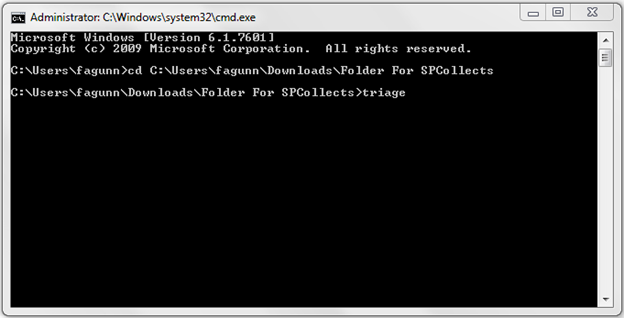
Then go to “RUN” in the Star Menu of Windows and type in “CMD”. This will open up the Windows Command Prompt. Change the directory to the file you created to hold the “.Tar” file. And type “triage” to kick off the Triiage tool.
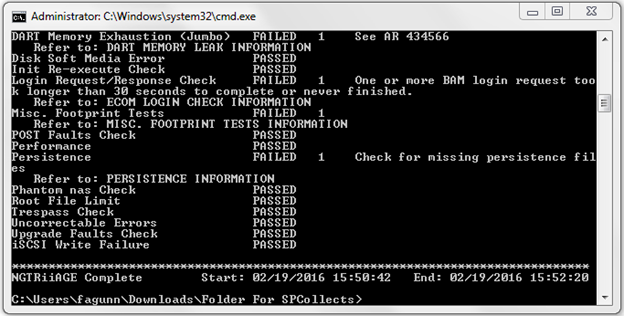
After the tool is done you will be brought back to the prompt screen.
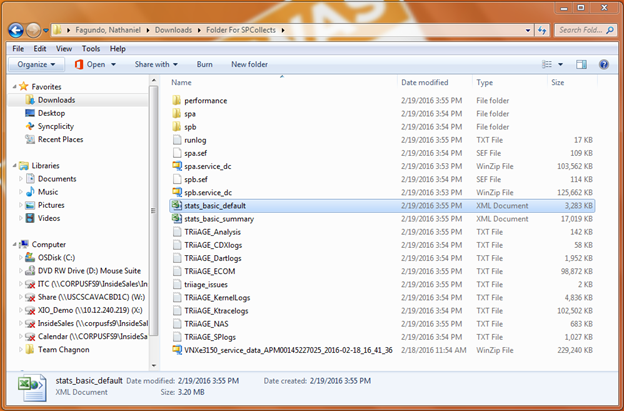
Then open the stats_basic_default file in excel and go to the summary tab. Here you can select what variables you would like to see in a graph. In the example below I selected the Read/Write IOPS for each Storage Processor.
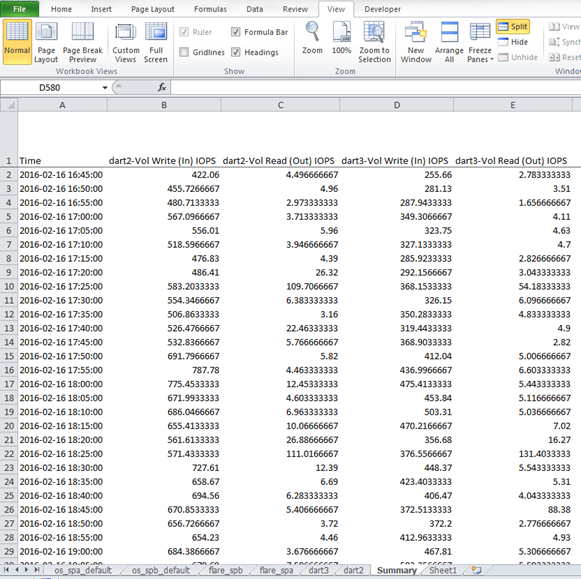
Then you can use Excels built in graph creation feature to get a nice timeline of the IOPS or Throughput for the VNXe.
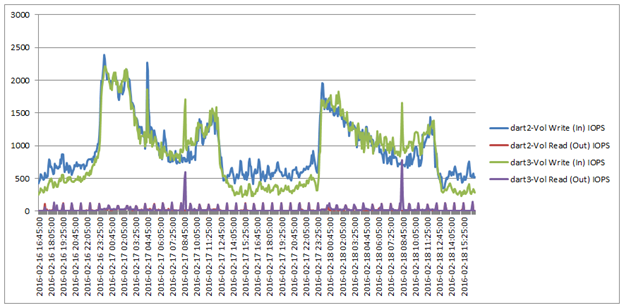
It is a bit of an eye chart but it’s better then nothing. The process is actually pretty easy after you get all the tools set up and do it once or twice.